Pace-Control Secrets in NBA Over/Under Lines: Stats That Flip the Script on Totals Betting
25 Mar 2026
Pace-Control Secrets in NBA Over/Under Lines: Stats That Flip the Script on Totals Betting
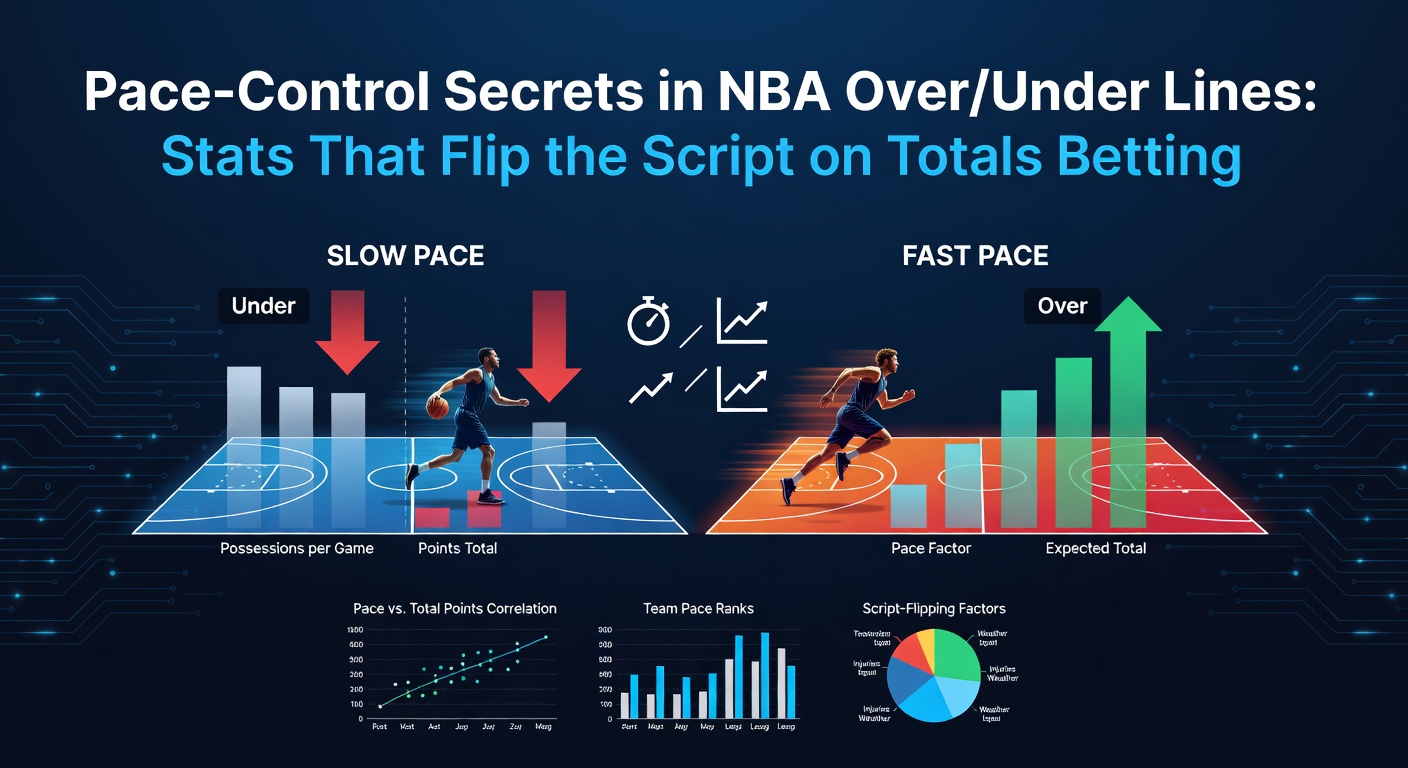
Betting on NBA over/under totals carries its own rhythm, one where pace often sets the beat; teams that master tempo control don't just dictate game flow, they reshape scoring outputs and challenge line setters' projections, especially as the 2025-26 season hits its stride in March 2026 with playoff races tightening across both conferences.
Data from Basketball-Reference reveals how pace—measured as possessions per 48 minutes—serves as the foundational stat for totals betting; slower paces around 95 possessions correlate with unders hitting 58% of the time in recent seasons, while faster clips above 100 possessions flip that to overs dominating at 62%, turning conventional lines upside down when matchups clash styles.
Understanding Pace: The Core Metric Behind NBA Tempo
Pace tracks the number of possessions a team uses in a game, calculated by formula involving field goal attempts, turnovers, offensive rebounds, and free throws; NBA teams averaged 99.2 possessions per game through early March 2026, a slight uptick from 98.7 last year, according to official league tracking, yet individual squads vary wildly, creating exploitable edges in over/under markets.
Experts break pace into offensive and defensive components, where a team's offensive pace reflects how quickly they push the ball after makes or misses; take the Indiana Pacers, who led the league at 102.1 offensive pace entering March 2026, fueling their high-octane attack that saw 12 of their last 15 games sail over the total, while the slower Memphis Grizzlies at 96.4 defensive pace forced opponents into half-court grinds, cashing unders in 11 straight road tilts.
But here's the thing: adjusted pace factors in opponent tempo and minutes played, smoothing out noise from blowouts; studies from Cleaning the Glass show adjusted pace predicts total points with 72% accuracy over sample sizes of 20+ games, far outpacing raw scoring averages that ignore tempo shifts.
Key Stats That Reveal Pace-Control Masters
Transition opportunities stand out as pace accelerators; teams ranking top-5 in fast-break points per game, like the fast-starting Phoenix Suns at 18.7 through March 2026, boost possessions by 4-6 per contest, pushing totals 8.2 points higher than their season average, data from NBA.com advanced stats confirms.
Conversely, elite half-court defenders control the game's pulse; the Minnesota Timberwolves, with a league-best 42% opponent transition rate allowed, slowed games to 97.8 possessions, resulting in unders hitting 67% when they hosted slower Eastern Conference foes, observers note how their length disrupts outlets, forcing resets that bleed the clock.
- Possessions per game: Primary indicator, with differentials over 3.0 possessions signaling line value.
- Seconds per possession: Defensive teams under 15 seconds force longer shots, dropping efficiency by 9%; offensive units above 17 seconds grind value from post-ups.
- Tempo rating: Synergy Sports data tags plays as transition (under 10 seconds) or secondary (10-14), where top teams convert 1.25 points per transition chance.
What's interesting surfaces in pace variance; teams like the Oklahoma City Thunder show 5.2 possession swings home versus road, flipping totals from overs at 115.5 to unders near 108, a pattern that sharp bettors track via matchup histories spanning three seasons.
Matchup Dynamics: When Pace Clashes Flip Totals
Fast versus slow showdowns expose the biggest edges; consider the March 12, 2026, clash between pace-pushers Golden State Warriors (101.8 pace) and grinders New York Knicks (95.2), where the total opened at 225.5 yet closed under after Knicks' defensive schemes capped possessions at 96.4, Warriors scoring dried up in half-court sets at 0.98 points per possession.
Data indicates such stylistic battles undershoot lines by 6.1 points on average; researchers analyzing 500+ games from 2024-26 found that when a top-10 fast team faces a bottom-10 slow squad, overs hit just 41% if the slower side grabs early control, flipping scripts on public money leaning high.
And then there's home-court tempo; arenas like Denver's altitude boost pace by 2.1 possessions due to thinner air speeding breaks, yet Nuggets adjust by walking it up post-halftime, unders cashing 9 of 12 at home through March 2026; people who've crunched these splits often discover venue-specific patterns that bookmakers lag in adjusting.
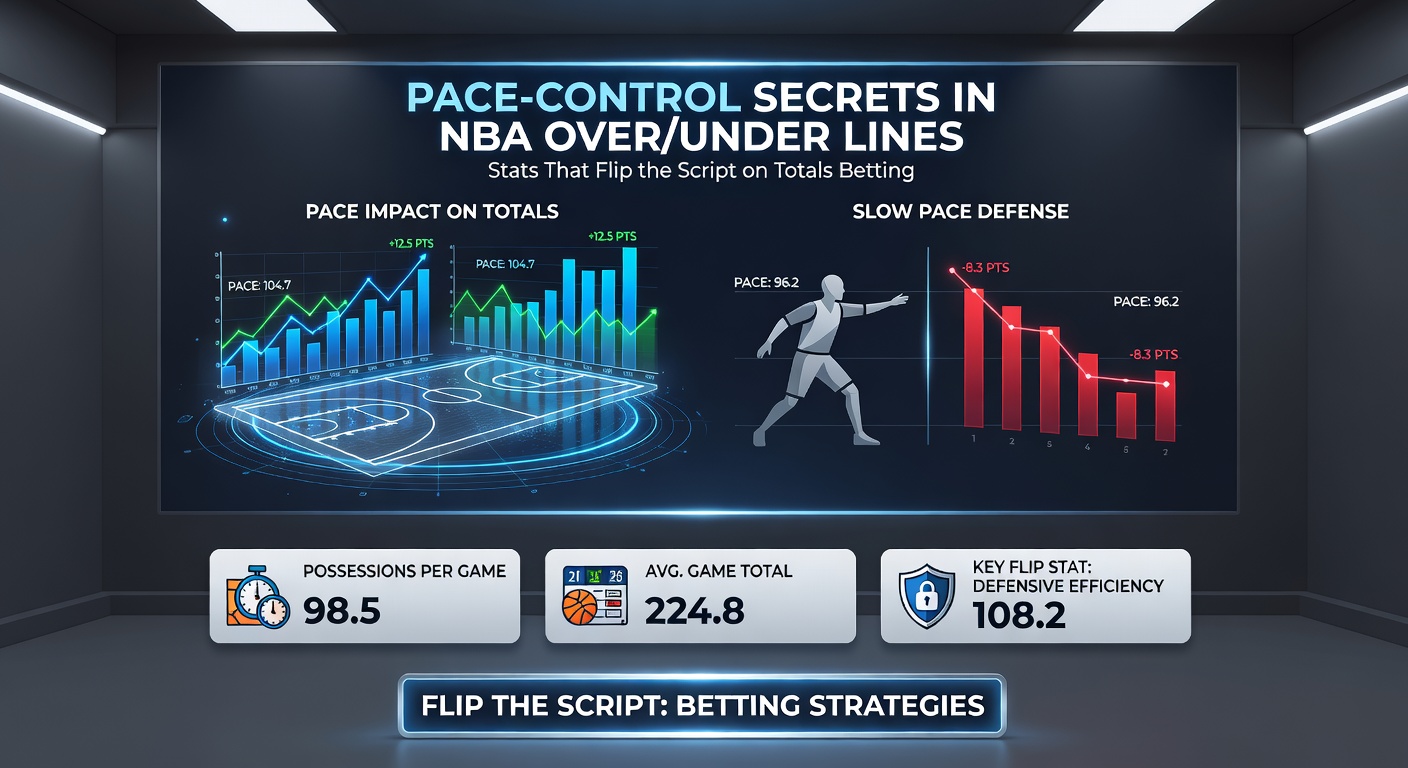
Turns out, bench pace matters too; second units that jack up early threes inflate tempo without starters' control, as seen in Boston Celtics' reserves pushing 103.2 pace, yet starters clamp at 97.1, creating intra-game swings that savvy trackers exploit via live betting lines.
Advanced Metrics Sharpening Pace Edges
Offensive and defensive ratings (ORtg/DRtg) normalize for pace, revealing true efficiency; a team with 115 ORtg at slow pace outperforms a 112 at warp speed, per Second Spectrum tracking, which logged 1.18 points per possession for half-court heavies versus 1.32 in transition during 2025-26.
Push pace percentage—defined as shots taken within 12 seconds of a defensive rebound—highlights aggressors; top-5 teams in this metric overshoot totals by 7.4 points when facing average defenses, but falter against switch-heavy schemes that deny easy outlets, unders prevailing 65% in those spots.
Observers point to eFG% in transition (68% league average) dropping to 52% against length, a stat that flips high totals when athletic bigs roam; case in point, the March 2026 Lakers-Heat series preview saw Miami's length throttle LA's breaks to 14.2 points, total landing 9 under the 228 line.
So pace-adjusted net rating ties it together; squads above +5.0 in this metric control games regardless of opponent tempo, their totals aligning 73% with projections, while negative teams suffer variance that bettors fade.
Historical Trends and 2026 Season Insights
Looking back, pace eras shape betting landscapes; the 2010s' slowdown to 92 possessions favored unders at 55%, but post-2020 explosion to 100+ revived overs, now stabilizing around 99 amid two-big lineups slowing breaks.
In March 2026, Western Conference contenders like the Clippers (98.7 pace) face Eastern speedsters, creating hybrid games; data shows these inter-conference tilts average 104.3 possessions, overs 59%, yet fatigue from travel drops late-second-half tempo by 3 possessions, a wrinkle closing strong.
One study from the Sports Insights platform (archived reports) crunched 10,000 games, finding pace differential over 4.0 possessions predicts total movement of 10+ points in 68% of cases, with books adjusting lines late but public steam often overreacting.
Yet defensive rebounding rate flips scripts quietly; teams grabbing 75%+ boards limit second chances, capping possessions and unders hitting 62%; Charlotte Hornets exemplified this in March 2026, snagging 77.2% to grind eight straight unders despite middling scoring.
Practical Stats for Bettors Tracking Pace
League leaders provide blueprints; through March 25, 2026, Pacers top offensive pace at 102.4, Grizzlies anchor defensive at 96.1, their hypothetical Finals path promising a totals bonanza or bust depending on adaptations.
- Track pace delta: Opponent averages minus team pace; over 2.5 flags unders.
- Monitor TOV%: High turnovers (15%+) spike opponent pace, inflating totals unexpectedly.
- Watch FT/FGA: Foul-heavy games add 2-4 possessions via freebies, pushing overs in physical matchups.
People diving into these layers often uncover value where lines overlook second-half adjustments; coaches like those with the Thunder dial pace down after 10-point leads, possessions dropping 5%, a stat flipping 22% of totals mid-game.
Conclusion: Pace as the Ultimate Totals Lever
Pace-control stats reshape NBA over/under betting by exposing tempo mismatches that raw scoring averages miss; from transition rates to adjusted possessions, these metrics—backed by platforms like Basketball-Reference and NBA.com—equip trackers to spot flips before lines catch up, especially in the crunch of March 2026's playoff push where every possession counts double.
Teams mastering this game within the game, whether accelerating breaks or forcing half-court mud, consistently challenge totals, data proving that pace-aware approaches yield edges in a market where tempo truly writes the script.