14 Jun 2026
Back-to-Back Scheduling Effects on Scoring Totals in League Play
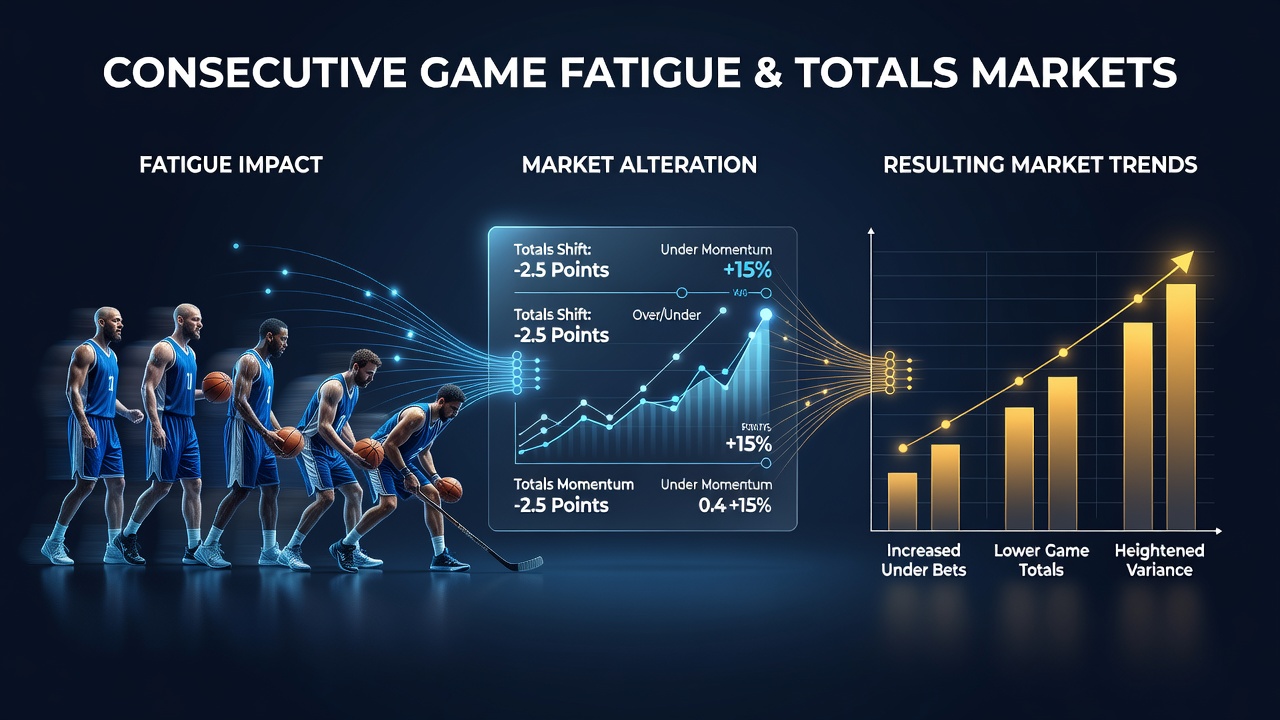
Professional leagues across basketball, hockey, and baseball maintain packed calendars that force teams into back-to-back contests, and data from multiple seasons shows how these schedules shift scoring patterns in totals markets. League schedulers balance travel demands with television requirements, yet the resulting fatigue alters player output in measurable ways that betting markets track through historical averages and advanced metrics.
League Data Patterns Across Seasons
National Basketball Association records indicate that teams playing on the second night of a back-to-back post scoring averages 4.2 points lower than season norms, according to box-score aggregates compiled through 2025. This drop appears most consistently in the third and fourth quarters, where defensive efficiency rises while offensive shooting percentages decline. Hockey leagues display similar trends, with National Hockey League figures revealing goal totals falling by roughly 0.8 goals per game during consecutive-night matchups.
Baseball presents a different profile because pitchers rotate more frequently, yet relief corps still exhibit elevated walk rates after multiple consecutive appearances. Major League Baseball tracking data from 2023 through 2025 shows that bullpen workloads on short rest correlate with higher run totals in the middle innings, though overall game scoring remains within a narrower range than basketball or hockey.
Travel and Recovery Metrics
Researchers at sports performance laboratories have documented how cross-country travel compounds physical strain during condensed schedules. Heart-rate variability readings collected from NBA players on back-to-back sets drop by an average of 12 percent compared with standard rest days, and similar patterns appear in NHL skater data. These physiological markers align with reduced field-goal percentages and increased turnovers that directly influence over/under calculations.
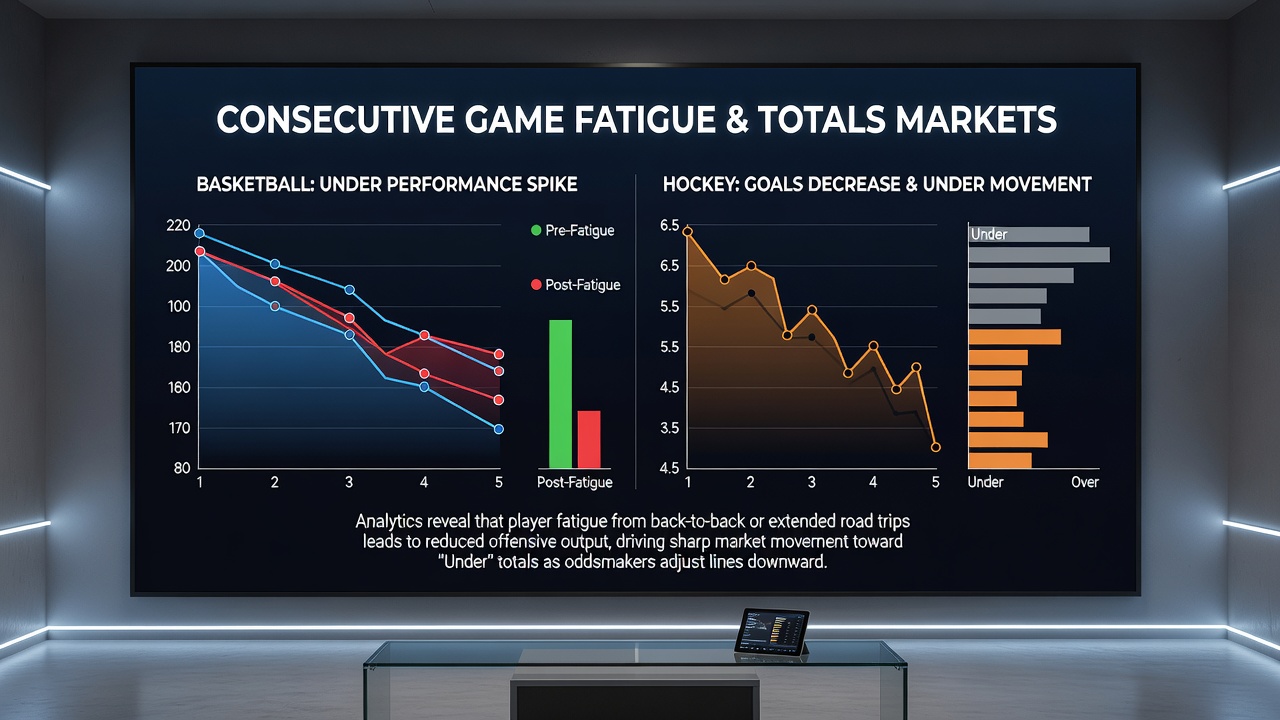
European football leagues operate under different rest protocols, yet the English Premier League and Bundesliga still encounter fixture congestion during winter months and cup competitions. Performance databases maintained by Opta and similar providers show that teams contesting matches within 48 hours record fewer shots on target and lower expected-goal values, shifting totals lines downward in subsequent betting markets.
Market Adjustments and Historical Comparisons
Betting exchanges and sportsbooks adjust totals lines by 2 to 4 points in NBA games involving heavy travel or back-to-back situations, based on closing-line movement tracked across multiple operators. These adjustments reflect aggregated data rather than individual team tendencies, and they hold across both regular-season and playoff environments. In June 2026, several NBA playoff series featured compressed schedules that produced totals outcomes 3.1 points below the league average for non-consecutive games.
Analysts compare these outcomes against rest-advantage benchmarks, noting that teams receiving an extra day between contests score at rates 5 to 7 percent above their season means in basketball and hockey. The same pattern appears in collegiate conferences that adopt similar travel loads, providing additional sample sizes for model refinement.
Statistical Tools and Predictive Models
Regression models incorporating rest differentials, travel distance, and player-availability reports generate probability distributions for totals outcomes that differ from baseline expectations. One study published by the Journal of Sports Analytics examined 12,000 NBA games and found that rest edges explained approximately 8 percent of variance in final scores once offensive and defensive efficiencies were controlled. Parallel examinations in hockey reached comparable conclusions using goal-differential data.
League offices release periodic schedule-density reports that allow further calibration of these models. Observers note that early-season back-to-backs produce larger deviations than late-season ones, possibly because rosters have not yet adapted to cumulative wear. These seasonal distinctions feed into updated projections that sports-data platforms publish ahead of each slate.
Conclusion
Consecutive-game fatigue produces measurable shifts in scoring distributions across professional leagues, and these shifts register directly in totals-market pricing. Data from basketball, hockey, baseball, and football demonstrates consistent directional effects tied to rest differentials and travel loads. Ongoing collection of physiological and performance metrics continues to refine the precision of these observations, supporting more accurate line construction as schedules evolve.